
You can’t improve what you don’t measure.
Many maintenance departments work hard every day, but without the right Key Performance Indicators (KPIs), it’s difficult to know whether maintenance activities are actually improving equipment reliability, reducing costs, or increasing production uptime.
Maintenance KPIs transform maintenance from a reactive support function into a strategic, data-driven operation. They help maintenance managers identify bottlenecks, justify budgets, prioritize improvements, and make informed decisions based on measurable results.
Whether you manage a power plant, manufacturing facility, textile mill, cement plant, food processing factory, or utility company, understanding maintenance KPIs is essential for achieving operational excellence.
What Are Maintenance KPIs?
Maintenance Key Performance Indicators (KPIs) are measurable metrics used to evaluate the effectiveness, efficiency, and reliability of maintenance operations.
They answer important questions such as:
- How reliable is our equipment?
- Are preventive maintenance tasks completed on time?
- How much downtime are we experiencing?
- How quickly do technicians respond to failures?
- Are maintenance costs increasing?
- Which assets require replacement?
KPIs provide objective data that supports continuous improvement.
Why Maintenance KPIs Matter
Tracking maintenance performance provides several advantages:
- Reduce equipment downtime
- Improve maintenance planning
- Increase equipment availability
- Extend asset lifespan
- Optimize maintenance budgets
- Improve technician productivity
- Support regulatory compliance
- Enable predictive maintenance initiatives
Organizations that monitor KPIs consistently can identify trends before they become major operational problems.
1. Mean Time Between Failures (MTBF)
Definition
MTBF measures the average operating time between equipment failures.
Formula
MTBF = Total Operating Time ÷ Number of Failures
Example
- Operating Time: 6,000 hours
- Failures: 12
MTBF = 500 hours
Why It Matters
A higher MTBF indicates more reliable equipment.
If MTBF decreases over time, maintenance teams should investigate recurring issues.
2. Mean Time To Repair (MTTR)
Definition
MTTR measures the average time required to repair equipment after a failure.
Formula
MTTR = Total Repair Time ÷ Number of Repairs
Example
- Total Repair Time: 40 hours
- Repairs: 10
MTTR = 4 hours
Goal
Lower MTTR means faster recovery and less production downtime.
3. Equipment Availability
Formula
Availability (%) = (Operating Time ÷ Planned Production Time) × 100
Why It Matters
High availability indicates that equipment is ready for production when needed.
Many industrial facilities target availability above 95%.
4. Preventive Maintenance Compliance
This KPI measures how many scheduled preventive maintenance tasks were completed on time.
Formula
PM Compliance (%) = (Completed PM Tasks ÷ Scheduled PM Tasks) × 100
Target
Most high-performing maintenance organizations aim for more than 90% compliance.
Low compliance often leads to increased equipment failures.
5. Planned Maintenance Percentage (PMP)
This metric measures the proportion of maintenance work that is planned versus reactive.
Formula
PMP (%) = (Planned Maintenance Hours ÷ Total Maintenance Hours) × 100
A higher percentage indicates a more proactive maintenance strategy.
6. Reactive Maintenance Percentage
Reactive maintenance measures work completed only after equipment failure.
Organizations with high reactive maintenance often experience:
- Increased downtime
- Higher repair costs
- Production losses
- Emergency overtime
The goal is to reduce reactive work while increasing planned maintenance.
7. Work Order Completion Rate
This KPI evaluates how efficiently maintenance teams complete assigned work.
Formula
Completion Rate = (Completed Work Orders ÷ Total Work Orders) × 100
A high completion rate reflects effective scheduling and resource allocation.
8. Maintenance Backlog
Maintenance backlog represents the amount of approved work that has not yet been completed.
Excessive backlog may indicate:
- Technician shortages
- Poor planning
- Insufficient spare parts
- Budget limitations
An appropriate backlog allows flexibility without delaying critical maintenance.
9. Maintenance Cost per Asset
This KPI measures the annual maintenance expenditure for each asset.
Tracking this metric helps identify:
- Aging equipment
- Frequent failures
- Replacement candidates
- Budget allocation priorities
10. Maintenance Cost as a Percentage of Replacement Asset Value (RAV)
This KPI compares annual maintenance costs with the replacement value of equipment.
High maintenance costs relative to RAV may indicate that replacing an asset is more economical than continuing repairs.
11. Emergency Work Order Percentage
Emergency maintenance disrupts planned schedules and often increases costs.
Formula
Emergency Work Orders ÷ Total Work Orders × 100
Reducing emergency work indicates a more mature maintenance program.
12. Spare Parts Stock Accuracy
Accurate inventory records ensure technicians have the right parts available when needed.
Poor stock accuracy can delay repairs and increase downtime.
Regular inventory audits help maintain accuracy.
13. Technician Productivity
Technician productivity measures how effectively maintenance personnel spend their working hours.
Common indicators include:
- Completed work orders
- Labor utilization
- Wrench time
- Average response time
Monitoring productivity helps optimize workforce planning and training.
14. Overall Equipment Effectiveness (OEE)
OEE combines three key factors:
- Availability
- Performance
- Quality
Formula
OEE = Availability × Performance × Quality
OEE provides a comprehensive measure of production efficiency and equipment performance.
15. Asset Failure Rate
This KPI tracks how frequently equipment fails over a given period.
Increasing failure rates often indicate:
- Aging assets
- Poor maintenance practices
- Improper operating conditions
- Inadequate preventive maintenance
Monitoring failure rates supports reliability improvement initiatives.
Common Maintenance KPI Mistakes
Organizations often struggle with KPIs because they:
- Track too many metrics
- Focus only on maintenance costs
- Ignore data quality
- Fail to review trends regularly
- Do not define KPI ownership
- Measure activity instead of outcomes
KPIs should drive decisions, not simply generate reports.
How CMMS Software Simplifies KPI Tracking
Calculating maintenance KPIs manually using spreadsheets is time-consuming and prone to errors.
A modern Computerized Maintenance Management System (CMMS) automates KPI tracking by collecting maintenance data in real time.
With a CMMS, organizations can:
- Track asset performance automatically
- Measure downtime accurately
- Monitor preventive maintenance compliance
- Analyze maintenance costs
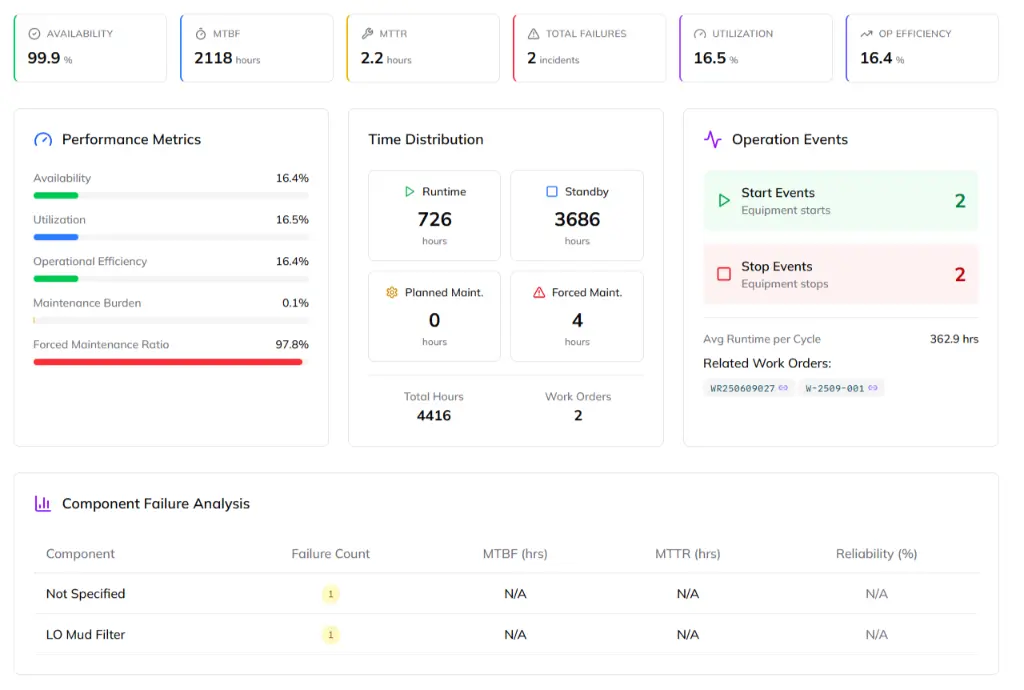
- Generate maintenance dashboards
- Compare plant performance across sites
This reduces administrative effort while improving decision-making.
How Wrysto Helps Measure Maintenance Performance
Wrysto includes built-in reporting and analytics designed for industrial maintenance teams.
The platform enables organizations to:
- Monitor preventive maintenance completion
- Track work order performance
- Measure equipment downtime
- Analyze maintenance costs
- Review technician productivity
- Maintain complete asset histories
- Generate KPI dashboards
- Support continuous improvement initiatives
With centralized maintenance data, managers can identify trends quickly and make informed operational decisions.
Best Practices for Using Maintenance KPIs
- Define clear KPI objectives.
- Use accurate maintenance data.
- Review KPIs regularly.
- Focus on continuous improvement rather than individual blame.
- Benchmark performance across departments or facilities.
- Align maintenance KPIs with business goals such as production, safety, and profitability.
Frequently Asked Questions
What is a maintenance KPI?
A maintenance KPI is a measurable indicator used to evaluate maintenance performance, equipment reliability, costs, productivity, and operational efficiency.
Which maintenance KPI is the most important?
There is no single most important KPI. Commonly tracked metrics include MTBF, MTTR, Preventive Maintenance Compliance, Equipment Availability, and Maintenance Cost.
How often should KPIs be reviewed?
Critical KPIs are often reviewed weekly or monthly, while strategic trends are analyzed quarterly or annually.
Can small manufacturers benefit from maintenance KPIs?
Yes. Even smaller facilities can improve equipment reliability and reduce costs by monitoring a focused set of KPIs.
Do I need a CMMS to track maintenance KPIs?
While KPIs can be calculated manually, a CMMS automates data collection and reporting, making KPI tracking more accurate and efficient.
Conclusion
Maintenance KPIs provide the visibility needed to transform maintenance from a reactive function into a strategic contributor to business performance. By measuring reliability, downtime, costs, productivity, and preventive maintenance effectiveness, organizations can make informed decisions that improve asset performance and reduce operational risk.
Rather than tracking every possible metric, focus on KPIs that align with your maintenance objectives and business priorities. Reliable data, consistent review, and continuous improvement are the foundation of an effective maintenance strategy.
Wrysto simplifies this process by automatically capturing maintenance data, generating real-time dashboards, and providing the insights needed to improve reliability, optimize maintenance resources, and support long-term operational excellence.